“It is the mark of a truly intelligent person to be moved by statistics.” — George Bernard Shaw
Introduction
Graphs are widely used tools in trading and investing to quickly see the past performance of the stock, the highs, the lows, trends, moving averages, trading volume, and much more. These graphs are the ‘footprint of money.’ One thing to always remember is that the charts don’t lie. The charts represent the money on the table at the end of the day. That is why they are of major importance.
Content: SPC: Graphical Interpretation
- What is Common and Special Cause?
- What are the 6 sources of variation
- How to read the graph?
- Conclusion
Objective
Walter Shewhart and W Edward Deming have done tremendous work to understand the variation in the process and its causes through statistical studies (mean, range, UCL, LCL, Cp, Cpk, Pp, Ppk, p, np, c, u). Understanding these variations is important to improving quality, reducing costs, and increasing productivity (QCD).
Control charts are plotted to understand the variation in the process for variable and attribute data. Different types of control charts are plotted based on the type of data and criticality of the problem. By understanding these charts and taking suitable actions, the process can be brought under statistical control.
Once you go through the article, you will understand the meaning of the mean and range chart, what is its purpose, how to do the graphical interpretation and how to make its best use.
Read More: http://bit.ly/VariableAttributeStudy
Definition: SPC: AIAG Manual 2nd Edition
SPC (Statistical Process Control): It is a collection of statistical techniques intended to understand the behaviour of a process.
Process Capability: It is determined by the variation that comes from the common causes. It generally represents the best performance of the process itself. This is demonstrated when the process is being operated in a state of statistical control regardless of the specification.
Common Cause: Variations that are consistently acting on the process. Produce a stable and repeatable distribution over time (in a state of statistical control)
Special Cause (Assignable causes): Variations that affect only some part of the process output. Often intermittent and unpredictable.
Variable Chart: It explains the process data in terms of its process variation, piece-to-piece variation, and its process average.
Specification Limits are the targets set for the process/product by customer or market performance or internal target. In short, it is the intended result on the metric that is measured. They have discrete values and can be counted for recording and analysis.
Control Limits are the indicators of the variation in the performance of the process. It is the actual values that the process is operating on. It is the real-time value.
Read More: http://bit.ly/CommonSpecialCause
Detailed Information
Dr Walter Shewhart developed the first control chart in the 1920s to describe common and special causes for Detection (tolerates waste) and Prevention (avoid waste)
The key objective of implementing statistical techniques is to
- Improve quality.
- Increase productivity.
- Reduce cost.
There is a fundamental law of nature that no two products or characteristics are exactly alike as processes contain many sources of variation. The differences may be immeasurably small or large, but they will always be there.
The sources of variation (for example: a Machine Shaft) could be (6M) due to variations in the
- Man (Operator)
- Machine (Maintenance)
- Material (Tool, Component)
- Method (Competence)
- Measurement (Error in measuring instrument)
- Mother Environment (Temperature, Humidity)
These changes/variations may occur,
- Gradually (from piece to piece)
- Stepwise (tool wear over time)
- Irregularly (environmental change, power surge)
Based on the pattern of the changes, the organization should decide the frequency of measurement so that variation in the process can be captured and action can be taken before the process goes out of control.
There are 2 key types of causes for the variation in the process.
- Common Cause: Variations that are consistently acting on the process. Produce a stable and repeatable distribution over time (in a state of statistical control)
- Special Cause (Assignable causes): Variations that affect only some part of the process output. Often intermittent and unpredictable.
Read More: http://bit.ly/VariableAttributeControlChart
The statistical study is built on the strategy of prevention. Based on the statistical study, there can be 3 key types of variation in the process
- Location (mean/central value)
- Spread (width/span)
- Shape (Pattern of variation-skewed, asymmetrical etc.)
The key goal is to maintain the location to the target value with minimal variability.
Read More: http://bit.ly/SPCandMSA
Summary of Special Cause Criteria
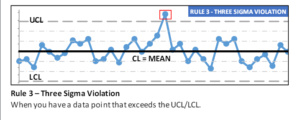
| 1 | 1 point > 3 standard deviations from the centerline |
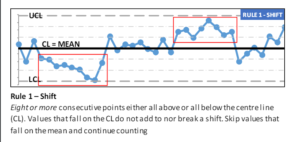
| 2 | 7 consecutive points on the same side of the centre line (either side) |
| 3 | 6 points in a row, all increasing or decreasing |
| 4 | 14 points alternating up and down |
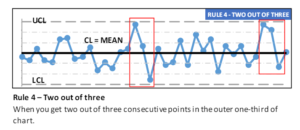
| 5 | 2 out of 3 points > 2 standard deviations from the centerline (same side) |
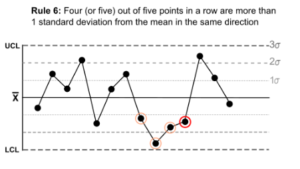
| 6 | 4 out of 5 points > 1 standard deviation from the centerline (same side) |
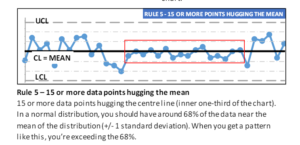
| 7 | 15 points in a row within 1 standard deviation of the centerline (either side) |
|
8 |
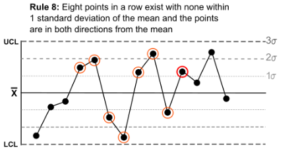
8 consecutive points > 1 standard deviation from the centerline (either side) |
Situation 1: 1 point > 3 standard deviations from the centerline
Situation 2: 7 consecutive points on the same side of the centre line (either side)
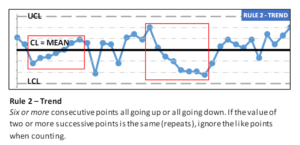 Situation 3: 6 points in a row, all increasing or decreasing.
Situation 4: 14 points alternating up and down.

Situation 5: 2 out of 3 points > 2 standard deviations from the centerline (same side)
Situation 6: 4 out of 5 points > 1 standard deviation from the centerline (same side)
Situation 7: 15 points in a row within 1 standard deviation of the centerline (either side)
Situation 8: 8 consecutive points > 1 standard deviation from the centerline (either side)
Read More: http://bit.ly/AttributeCharts
Possible reason for the Special Cause:
Man:
- The control limits or plot points have been miscalculated or misplotted
- The sampling method is stratified
- Data has been edited
- New inspector
Machine:
- Equipment malfunction
- Loose fixture
Material:
- A new raw material lot
- Lot to lot variation
- Tool worn out
Method:
- The measurement system has changed (Earlier from Micrometer and now from Vernier)
Measurement:
- New gauge
Mother Earth
- Variation in temperature (summer and winter: Paint viscosity)
Read More: http://bit.ly/SpecificationControlLimits
Possible Actions
- Review the log
- Analyse the date and time (shift) when the variation started
- Check the 6M change which may have triggered the variation
- If it improves the process, make it permanent
- If it deteriorates the process, take action (like training) so that it can be avoided in the future.
Read More: http://bit.ly/DifferenceMeanMedianMode
Conclusion:
The purpose of the mean and range chart is to understand the process variation. Based on the 8 different scenarios, the user can analyse and decide the possible cause of the variation, whether it can impact the process or not, whether any action needs to be taken or not and what actions need to be taken on 6M so that process variation can remain under control in the manufacturing process.
Read More: http://bit.ly/CommonSpecialCause
Industry Challenges:
- How often is the objective of the statistical study to understand the variation in the process rather than achieve Cp and CpK values?
- How often are special causes eliminated before calculating the process capability and process performance (Cp, Cpk)?
- How often control charts are selected (variable or attribute) based on the requirement and not based on the convenience of the available software?
- Why do the majority of organizations use only variable control charts and not attribute control charts?
References:
IATF 16949 Standard
SPC AIAG Manual 2nd Edition
Industry Experts
This is the 212th article of this Quality Management series. Every weekend, you will find useful information that will make your Management System journey Productive. Please share it with your colleagues too.
In the words of Albert Einstein, “The important thing is never to stop questioning.” I invite you to ask anything about the above subject. Questions and answers are the lifeblood of learning, and we are all learning. I will answer all questions to the best of my ability and promise to keep personal information confidential.
Your genuine feedback and response are extremely valuable. Please suggest topics for the coming weeks.