“All we are doing is looking at the timeline from the moment a customer gives us an order to the point we collect the cash. And we are reducing that timeline in the value stream by removing non-value-added wastes.” – Taiichi Ohno
Introduction
When we plan to go for a vacation, we plan everything in detail. It could be related to the location, the number of days, type of hotel, food preference, mode of transport etc. We map every possible thing before we step out so that we can enjoy our vacation the way we want it to be.
Objective
Every company has numerous processes and for its activities to flow effectively and efficiently, it is necessary to understand the interrelationship between them, identifying possible gaps in the internal structure. Several tools assist in process management, such as the Turtle Diagram.
Although its use is easy and extremely important, there are still few organizations that choose to use it. The following text describes more information about the turtle diagram and includes some of the numerous benefits that its use can bring.
Definition (ISO 9000: 2015):
Process (Cl 3.4.1): Set of interrelated or interacting activities that uses input to deliver an intended output
Output (Cl 3.7.5): Result of a process
Performance (Cl 3.7.8): Measurable result
Measurement (Cl 3.11.4): Process to determine a value
Read More: https://bit.ly/WhatEmbeddedSoftware
Detailed Information
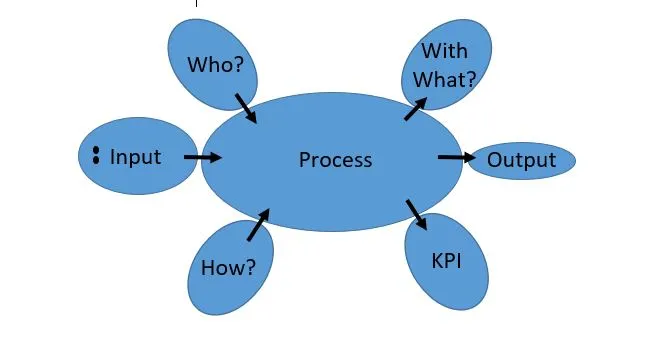
The ‘Turtle Diagram’ is a visual tool that can be used to describe all elements of any process within an organization in a very precise and detailed way. It brings all aspects including inputs, outputs, and criteria metrics among other information that may be relevant and assist in improving organizational processes.
In other words, it is a that makes up a single process. In short, a turtle diagram is used to illustrate the 1-page plan for a single process including the resources needed to achieve the process’s purpose
When one Turtle Diagram is coupled with others from the same management system and a common audit trail, (i.e., new customer, new product, new process, new employees, new supplier, etc.) is followed, an auditor can easily test the sequence and interaction of all of the organization’s process against a common theme.
Why is it called a “turtle”?
Looking at the image, it can be seen that the layout of the steps in the diagram forms a drawing similar to that of a turtle. The name is very different when we use it in corporate environments, but somehow everyone prefers to call it a ‘Turtle Diagram.’
Read More: https://bit.ly/PESTLEANALYSIS
Linkage with ISO Standard
There are numerous clauses in ISO 9001:2015/IATF 16949: 2016 standard, which can be addressed, by using a turtle chart such as follows.
- 4.1, Understanding the organization and its context
- 4.2, Interested parties
- 4.4, Management system process
- 5.2, Quality policy
- 6.1, Risk Management
- 7.2, Competence
- 7.4, Communication
- 10.3, Continual improvement
Is a Turtle diagram required in ISO 9001:2015 / IATF 16949: 2016?
There are no requirements for organizations to develop Turtle Diagrams! ISO 9001, Clause 4.1 states, “The organization shall identify the processes needed for the QMS and their application throughout the organization and determine the sequence and interaction of these processes.”
There may not be a requirement specifically for the turtle diagram, but it may help each organization to meet the requirements to determine and manage numerous linked activities to enable the transformation of inputs and outputs.
Read More: https://bit.ly/WhatisCyberSecurity
How to use a Turtle Diagram?
Using a turtle diagram is simple. It is made up of 6 areas, all surrounding the process, which is considered the turtle body. The 6 areas are:
- Inputs
- Outputs
- How (support process, procedures & methods)
- With What (materials & equipment used)
- With Whom (competence, skill, training)
- What Results (performance indicators)
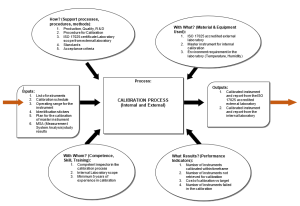
Inputs: This category should define the details of the actual process including documents, materials, information, requirements, etc.
Outputs: This should include details of the key output of the process like audit result, finished product, approved purchase order etc.
How (support process, procedures & methods): Support materials include procedures, instructions, specific methods, etc. Which are the different processes which may be supporting the process in turtle-like for the maintenance process, the support processes could be stores, purchase, production etc.
With What (materials & equipment used): This section is dedicated to finding the resources needed to perform the process. As for the production process, it could be a CNC machine, CMM, roughness tester etc.
With Whom (competence, skill, training): This section is dedicated to finding all the employees whose roles within the organization have the responsibility for value-adding steps within the process. As for the qualified internal auditor, it could be training related to process approach, core tools like APQP, PPAP, FMEA, SPC, MSA etc.
What Results (performance indicators): This section looks at the measures the organization has to monitor how well the process is performing. If the measures align with the organization’s plan, policies, goals, and objectives, then the measures should be able to tell management if the process is fulfilling or needs to be adjusted or improved. Example: For the Sales process, the key indicators could be new customer addition, sales target achievement, increase in SOB (share of business) etc.
Process: The centre of the diagram is titled “process”. This box addresses the value-adding step and any sequence that falls within the scope of the process. A process could be sales, purchase, production planning, new product development, production, quality assurance, stores, despatch etc.
Read More: https://bit.ly/GeneralDataPR
Possible Benefits
The Turtle Diagram can be used in conjunction with flowcharts, work instructions or Standard Operating Procedures (SOPs), correlating the information in a simple and easy-to-read diagram. There are many benefits to using this diagram. Some of them are described below.
Easy-to-understand document
Turtle diagrams are perfect for sharing with new employees during onboarding, so they understand the position of their role within the organization as well as the added value that their tasks will bring to the company
Easy tool for use in audits
It can facilitate auditors and organizations themselves in internal and external audits, guiding them in different ways as to which people and documents need to be audited in each process.
It can be an individual audit of a process or the evaluation of its interaction with other processes within the company, when turtle diagrams are used with supporting documents such as SOPs (Standard Operating Procedure), it is simple to perform an audit trail in the organization. It is possible to quickly and easily identify areas that need improvement or areas that need to be better related and interacted with other processes.
Alignment of organization goals linked to processes
Through the use of the turtle diagram, it is possible to align the performance of the processes to the organization’s objectives and applicable policies. It helps understand how process performance can assist in achieving certain organizational goals, such as customer satisfaction, and how these goals link to the organization’s business plan and policies.
Easy identification of process waste
Management can identify stages that are reducing the value or even activities that may be distracting the addition of value. Therefore, with a quick look at the diagram is possible to verify where there is waste within a process.
Read More: https://bit.ly/FaultTreeAnalysisFTA
Industry Challenges:
- How often turtle diagrams are prepared by the cross-functional team?
- How often the turtle diagram is reviewed once it is prepared (any review frequency)?
- How often does the senior management analyse the benefits the organization is getting by preparing a turtle diagram?
Read More: https://bit.ly/SWOTAnalysisEV
References:
ISO 9001: 2015
IATF 16949: 2016
IATF 16949: 2016, Sanctioned Interpretation & FAQ
Industry Experts
This is the 157th article of this Quality Management series. Every weekend, you will find useful information that will make your Management System journey Productive. Please share it with your colleagues too.
In the words of Albert Einstein, “The important thing is never to stop questioning.” I invite you to ask anything about the above subject. Questions and answers are the lifeblood of learning, and we are all learning. I will answer all questions to the best of my ability and promise to keep personal information confidential.
Your genuine feedback and response are extremely valuable. Please suggest topics for the coming weeks.