“Life is a journey, take time to appreciate every red, yellow, and green light along the way.” – Unknown
Introduction
These days we always look for quick results. It could be fast money transfer, ordering food, buying something online, getting high subscribers on YouTube and much more. But the important factor is that the process should be simple and reliable.
Content: SPC: What is Stoplight Control?
- What is the Stoplight Control?
- Where it can be used?
- How to use it?
- Conclusion
Objective
Walter Shewhart and W Edward Deming have done tremendous work to understand the variation in the process and its causes through statistical studies (mean, range, UCL, LCL, Cp, Cpk, Pp, Ppk, p, np, c, u). Understanding these variations is important to improve quality, reduce cost and increase productivity (QCD).
The Stoplight Control Chart can be used where the process is in statistical control, measurement variability is acceptable and where high competence of the operator is not possible.
Once you go through the article, you will understand the meaning of the Stoplight Control Chart, what is the purpose and how to make its best use.
Read More: http://bit.ly/VariableAttributeControlChart
Definition: SPC: AIAG Manual 2nd Edition
SPC (Statistical Process Control): It is a collection of statistical techniques intended to understand the behaviour of a process.
Process Capability: It is determined by the variation that comes from the common causes. It generally represents the best performance of the process itself. This is demonstrated when the process is being operated in a state of statistical control regardless of the specification.
Common Cause: Variations that are consistently acting on the process. Produce a stable and repeatable distribution over time (in a state of statistical control)
Special Cause (Assignable causes): Variations that affect only some part of the process output. Often intermittent and unpredictable.
Variable Chart: It explains the process data in terms of its process variation, piece-to-piece variation, and its process average.
Specification Limits are the targets set for the process/product by customer or market performance or internal target. In short, it is the intended result on the metric that is measured. They have discrete values and can be counted for recording and analysis.
Control Limits are the indicators of the variation in the performance of the process. It is the actual values that the process is operating on. It is the real-time value.
Read More: http://bit.ly/CommonSpecialCause
Detailed Information
Dr Walter Shewhart developed the first control chart in the 1920s to describe common and special causes for Detection (tolerates waste) and Prevention (avoid waste)
The key objective of implementing statistical techniques is to
- Improve quality.
- Increase productivity.
- Reduce cost.
There is a fundamental law of nature that no two products or characteristics are exactly alike as processes contain many sources of variation. The differences may be immeasurably small or large, but they will always be there.
Read More: http://bit.ly/AttributeCharts
The statistical study is built on the strategy of prevention. Based on the statistical study, there can be 3 key types of variation in the process
- Location (mean/central value)
- Spread (width/span)
- Shape (Pattern of variation-skewed, asymmetrical etc.)
The key goal is to maintain the location to the target value with minimal variability.
Read More: http://bit.ly/SPCandMSA
What is a Stoplight Control Chart?
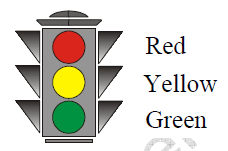 The stoplight control chart is similar to a traffic light wherein by using three different colour codes (Green, Yellow and Red), an organization can identify whether the process is in control or not. In this chart, both process location and variation are controlled using one chart. In this, the chart tracks the number of data points in the sample in each category (Green Yellow and Red)
One important aspect of this chart is that specification limits (Say 5.0 -0.1, +0.1) are plotted to check the performance of the process, unlike the mean and control charts wherein control limits are plotted.
Read More: https://bit.ly/SPCControlChart
Assumption Before Starting the Study:
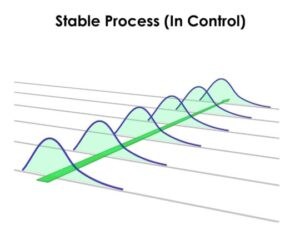 The process is in statistical control
- Process performance and measurement variability (MSA) are acceptable
- The process is on target
It means that before going ahead with the stoplight chart, the organization should use a control chart to check the common and special causes and once the process is stable, they can opt for this type of chart.
What is the Purpose of the Stoplight Control Chart?
The following are the key purposes for using this chart.
- Ease of operator: This chart can be implemented at the operator level without involving any mathematics.
- Loose Tolerance: Wherever the tolerances are wide enough any variation does not impact the process immediately. Like in the furnace, the tolerance is generally -10 to +10 degrees.
- Easy to use: There is a myth that SPC study is very complicated and requires a complicated formula.
Read More: http://bit.ly/DifferenceMeanMedianMode
How to Use Stoplight Control Chart?
 The quantification and analysis of the process require variable data. In this study, double sampling is used. There are three categories.
- Target area: Green (86.6%)
- Warning area: Yellow (13.2%)
- Stop Zone: Red (0.3%)
Read More: https://bit.ly/SPCGoalpost
Steps for conducting the study:
- Break the sample size of 5 into 2 and 3
- Check 2 pieces, if both pieces are in the Green area, continue to run the production
- If one or both samples are in Red, stop the production, take action and repeat S.No. 2.
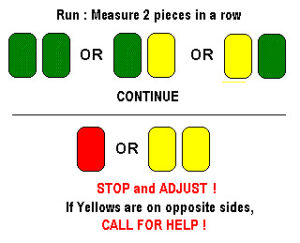 If one or two are in the Yellow zone, take 3 more samples. If any piece is in Red, stop the production, take action and repeat S.No. 2.
- If no piece falls in the Red zone but 3 or more falls in the Yellow zone, stop the production, take action and repeat S.No. 2.
- If 3 pieces are in Green and 2 are in Yellow, continue the production.
In certain cases, the instrument like the dial indicator or air indicator column is best suited as the instrument background can be coloured in Green, Yellow and Red.
Read More: http://bit.ly/SpecificationControlLimits
Conclusion:
The purpose of the SPC study is to understand the process variation. The Stoplight control chart can be used where the competence of operator is low and the process is stable. By using Green, Yellow and Red colours, the monitoring of the process performance can be done.
Read More: http://bit.ly/CommonSpecialCause
Possible Challenges
- The disadvantage of the stoplight chart is that it has a high False Alarm rate (the possibility of calling the process Bad when it is Good).
References:
IATF 16949 Standard
SPC AIAG Manual 2nd Edition
Industry Experts
This is the 215th article of this Quality Management series. Every weekend, you will find useful information that will make your Management System journey Productive. Please share it with your colleagues too.
In the words of Albert Einstein, “The important thing is never to stop questioning.” I invite you to ask anything about the above subject. Questions and answers are the lifeblood of learning, and we are all learning. I will answer all questions to the best of my ability and promise to keep personal information confidential.
Your genuine feedback and response are extremely valuable. Please suggest topics for the coming weeks.
Leave a Reply
You must be logged in to post a comment.