“All differences in this world are of degree, and not of kind because oneness is the secret of everything”. Swami Vivekananda
Introduction
When boys and girls are dating each other, they put in their best. It could be dress, manners or being on time. As time passes and they become life partners, things start changing. Now both start taking each other for granted, the urge to put in their best is not always there and the expectation is that others will understand their need!
Content: SPC: Difference Between CpK and Ppk
1. What are the Cpk and Ppk?
2. What is the key difference between the two?
3. How to use it?
4. Conclusion
Objective
Walter Shewhart and W Edward Deming have done tremendous work to understand the variation in the process and its causes through statistical studies (mean, range, UCL, LCL, Cp, Cpk, Pp, Ppk, p, np, c, u). Understanding these variations is important to improve quality, reduce cost and increase productivity (QCD).
During new development, a new manufacturing process is set up and a statistical study is carried out to verify the process performance (Ppk). When the product is handed over for mass production, routine production starts. Now statistical study is carried out to predict the performance of the process so that desired action can be taken proactively (Cpk).
Once you go through the article, you will understand the meaning of Ppk and Cpk, their key difference and how to interpret them.
Read More: http://bit.ly/VariableAttributeControlChart
Definition: SPC: AIAG Manual 2nd Edition
SPC (Statistical Process Control): It is a collection of statistical techniques intended to understand the behaviour of a process.
Process Capability: It is determined by the variation that comes from the common causes. It generally represents the best performance of the process itself. This is demonstrated when the process is being operated in a state of statistical control regardless of the specification.
Common Cause: Variations that are consistently acting on the process. Produce a stable and repeatable distribution over time (in a state of statistical control)
Special Cause (Assignable causes): Variations that affect only some part of the process output. Often intermittent and unpredictable.
Variable Chart: It explains the process data in terms of its process variation, piece to piece variation, and its process average.
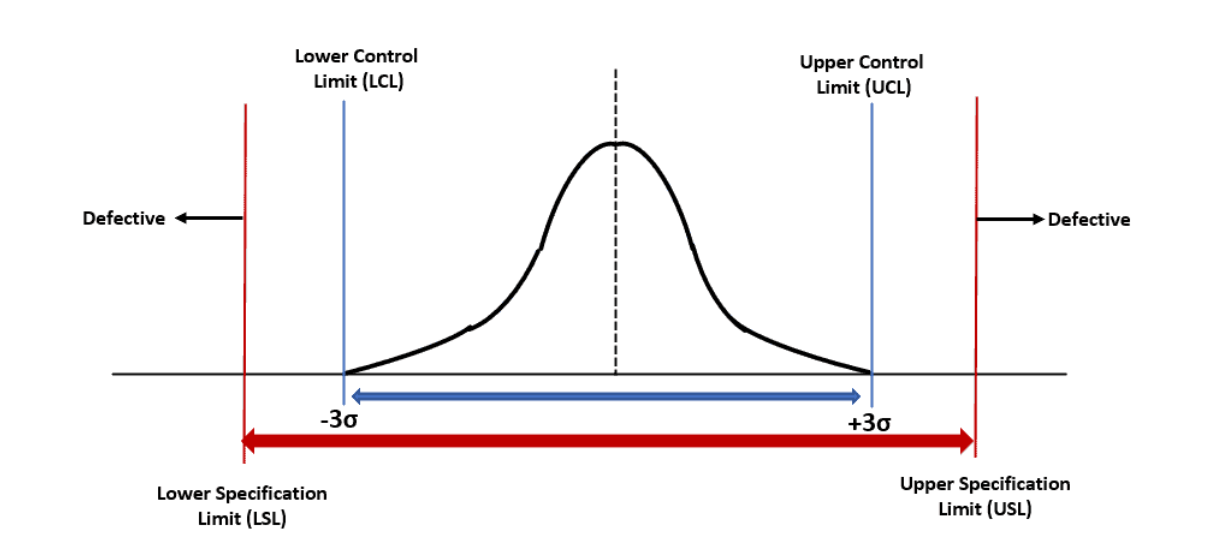
Specification Limits are the targets set for the process/product by customer or market performance or internal target. In short, it is the intended result on the metric that is measured. They have discrete values and can be counted for recording and analysis.
Control Limits are the indicators of the variation in the performance of the process. It is the actual values that the process is operating on. It is the real-time value.
Read More: http://bit.ly/CommonSpecialCause
Detailed Information
Dr Walter Shewhart developed the first control chart in the 1920s to describe common and special causes for Detection (tolerates waste) and Prevention (avoid waste)
The key objective of implementing statistical techniques is to
– Improve quality.
– Increase productivity.
– Reduce cost.
There is a fundamental law of nature that no two products or characteristics are exactly alike as processes contain many sources of variation. The differences may be immeasurably small or large, but they will always be there.
Read More: http://bit.ly/AttributeCharts
The statistical study is built on the strategy of prevention. Based on the statistical study, there can be 3 key types of variation in the process
1. Location (mean/central value)
2. Spread (width/span)
3. Shape (Pattern of variation-skewed, asymmetrical etc.)
The key goal is to maintain the location to the target value with minimal variability.
Read More: https://bit.ly/StopLightControl
The Key Difference Between Ppk and Cpk Study:
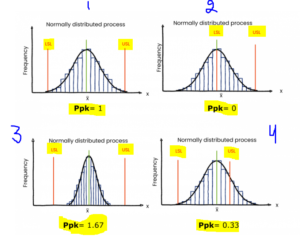
The goal of capability analysis is to ensure that a process is capable of meeting customer specifications and we use capability statistics such as Cpk and Ppk to make that assessment. Cpk and Ppk are about process capability and process performance, respectively.
 Read More: https://bit.ly/SPCGoalpost
Graphical Interpretation of Cpk and Ppk Study:

Read More: http://bit.ly/SpecificationControlLimits
The Formula for Calculating Cpk and Ppk:

Read More: https://bit.ly/SPCControlChart
Difference Between Cpk and Ppk Based on Data:
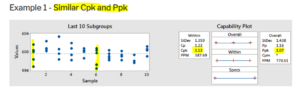

Read More: http://bit.ly/DifferenceMeanMedianMode
Conclusion:
The purpose of the SPC study is to understand the process variation. Both Ppk and Cpk study have their unique purpose and interpretation. Ppk study is relevant during new development and Cpk study is primarily used during mass production. While the Ppk study considers the variation in all the samples and includes both common and special causes of variation, the Cpk study considers the variation within the subgroup. It considers only the common cause of variation.
Read More: http://bit.ly/CommonSpecialCause
References:
IATF 16949 Standard
SPC AIAG Manual 2nd Edition
Industry Experts
This is the 217th article of this Quality Management series. Every weekend, you will find useful information to make your Management System journey Productive. Please share it with your colleagues too.
In the words of Albert Einstein, “The important thing is never to stop questioning.” I invite you to ask about anything related to the above subject. Questions and answers are the lifeblood of learning, and we are all learning. I will answer all questions to the best of my ability and promise to keep personal information confidential.
Your genuine feedback and response are extremely valuable. Please suggest topics for the coming weeks.
Leave a Reply
You must be logged in to post a comment.