“Those who ignore Statistics are condemned to reinvent it.” – Brad Efron
Introduction
When an organization hires GETs (Graduate Engineer Trainees), they set a minimum mark limit (say minimum 65%). The selected candidates may have marks ranging from 65% to 90%. Will there be any difference between the competence of the candidate having 65% marks compared to 90%? The logical answer is yes but both will get the same salary and both meet the criteria!
Content: SPC: Why SPC Study?
- What is the Goal Post Mentality?
- What is Loss Function Analysis?
- Why it is important to understand it?
- Conclusion
Objective
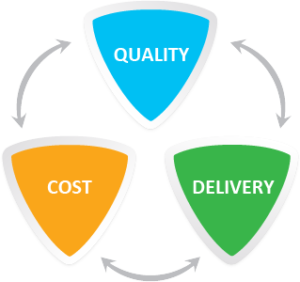
Walter Shewhart and W Edward Deming have done tremendous work to understand the variation in the process and its causes through statistical studies (mean, range, UCL, LCL, Cp, Cpk, Pp, Ppk, p, np, c, u). The understanding of these variations is important to improve quality, reduce cost and increase productivity (QCD).
There are many logical and justified reasons to conduct SPC studies and there are a few reasons why we should not conduct the statistical study. When an SPC study is conducted, it helps the organization to reduce costs, improve productivity and enhance quality.
Once you go through the article, you will understand the meaning of Goal Post Mentality, What is Loss Function Analysis, what is the purpose and how to make its best use.
Read More: http://bit.ly/VariableAttributeControlChart
Definition: SPC: AIAG Manual 2nd Edition
SPC (Statistical Process Control): It is a collection of statistical techniques intended to understand the behaviour of a process.
Process Capability: It is determined by the variation that comes from the common causes. It generally represents the best performance of the process itself. This is demonstrated when the process is being operated in a state of statistical control regardless of the specification.
Common Cause: Variations that are consistently acting on the process. Produce a stable and repeatable distribution over time (in a state of statistical control)
Special Cause (Assignable causes): Variations that affect only some part of the process output. Often intermittent and unpredictable.
Variable Chart: It explains the process data in terms of its process variation, piece-to-piece variation, and its process average.
Specification Limits are the targets set for the process/product by customer or market performance or internal target. In short, it is the intended result on the metric that is measured. They have discrete values and can be counted for recording and analysis.
Control Limits are the indicators of the variation in the performance of the process. It is the actual values that the process is operating on. It is the real-time value.
Read More: http://bit.ly/CommonSpecialCause
Detailed Information
Dr Walter Shewhart developed the first control chart in the 1920s to describe common and special causes for Detection (tolerates waste) and Prevention (avoid waste)
 The key objective of implementing statistical techniques is to
- Improve quality.
- Increase productivity.
- Reduce cost.
There is a fundamental law of nature that no two products or characteristics are exactly alike as processes contain many sources of variation. The differences may be immeasurably small or large, but they will always be there.
Read More: http://bit.ly/AttributeCharts
The statistical study is built on the strategy of prevention. Based on the statistical study, there can be 3 key types of variation in the process
- Location (mean/central value)
- Spread (width/span)
- Shape (Pattern of variation-skewed, asymmetrical etc.)
The key goal is to maintain the location to the target value with minimal variability.
Read More: http://bit.ly/SPCandMSA
Goal Post Mentality:
 All parts within the tolerance are considered to be equally good. Goal Post uses a sports metaphor that no matter how the ball passes into the goal, the scores are updated the same amount.
Example: In a Football match, irrespective of the location from where the football is entering the goal post, it is considered to be a goal.
The same philosophy applies to product quality. As long as the features were within the tolerances, then each of the products produced was considered to be equally good.
Read More: https://bit.ly/SPCControlChart
Loss Function:
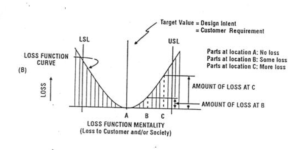
 The Loss Function first introduced by a Japanese Statistician Genichi Taguchi, is a theoretical function measuring the Cost to Society of a measurement as the process drifts from the optimal value.
Let us take an example of radial ‘run out’ of a Tyre. If the specification for a Tyre is a maximum of 0.025″ of ‘run out’, do you think a Tyre with 0.005″ of ‘run out’ performs the same for the customer as a Tyre with 0.025″ that barely passes specification? The second Tyre will have increased vibration seen by the customer, thus decreasing their satisfaction.
Example:
 Keeping with a sports-related metaphor, the Loss Function is similar to archery. This is defined as “bull’s eye”, and as arrows stray from the “bull’s eye”, the points given to the archer are worth less the further away from the “bull’s eye” an arrow hits.
Read More: http://bit.ly/DifferenceMeanMedianMode
On many occasions, the loss function is considered to be a parabolic function between the dimension’s lower and upper tolerances with the lowest cost at the tolerance nominal (mid-point) and becomes a flat line beyond the tolerances. This is called the Nominal Loss Function. The Loss Function changes to the customer’s requirements.
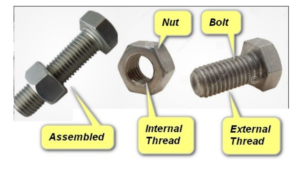
 Example: The fitment between Nut and Bolt. If the dimensions are in the centre, the fitment will be perfect but if there is a variation in the dimension of the nut and bolt, the fitment will be loose. Say if the outer diameter of the bolt is lower than the inner diameter of the nut, the fitment will be loose. Depending upon the type of tolerance fit (interference fit, transition fit or clearance fit), dimension needs to be controlled.
Read More: https://bit.ly/MSASWIPE
Loss to Society:
Costs to Society may include:
- Cost of labour to manufacture the product being scrapped.
- Cost of labour to rework/reprocess/repair/replace product.
- Customer acquisition costs, especially if the customer is lost.
- Labour costs of a customer attempting to use the product.
- Customer service costs.
- Warranty costs.
- Complaint/Investigative Costs.
Read More: http://bit.ly/SpecificationControlLimits
Conclusion:
The purpose of the SPC study is to understand the process variation. The Goalpost mentality ensures that only those parts are accepted which meet the specifications. The loss function focuses on meeting the design intent wherein any value going away from the centre has a possibility of some loss to the organization or society.
Read More: http://bit.ly/CommonSpecialCause
References:
IATF 16949 Standard
SPC AIAG Manual 2nd Edition
Industry Experts
This is the 214th article of this Quality Management series. Every weekend, you will find useful information that will make your Management System journey Productive. Please share it with your colleagues too.
In the words of Albert Einstein, “The important thing is never to stop questioning.” I invite you to ask anything about the above subject. Questions and answers are the lifeblood of learning, and we are all learning. I will answer all questions to the best of my ability and promise to keep personal information confidential.
Your genuine feedback and response are extremely valuable. Please suggest topics for the coming weeks.
Leave a Reply
You must be logged in to post a comment.